
A bull trap in crypto is a price chart formation that traders need to be aware of as it results from a bullish sentiment turning bearish. Read on to learn what a bull trap is, why it occurs, and how to spot one.
What Is a Bull Trap?
A bull trap is a situation where a trader buys an asset after an upward price movement, but the price suddenly shifts to a sharp downward trend.
In a bull trap, unsuspecting traders may think of this period as a perfect time to open long positions, hoping for a continuing price rally. However, this decision may lead to losses. Traders caught in a bull trap have to exit their positions to avoid further losses.
Notably, a bull trap may also occur at the end of an uptrend due to lower buying pressure and higher selling pressure as traders take a profit.
What Causes a Bull Trap in Crypto?
Some actions, such as market manipulation or spreading false information, may trigger a false bull run in the crypto asset markets. Since there aren’t credible foundations for a bullish trend, the uptick will be short-lived.
Suppose an altcoin has been on a bearish trend for a long time. If it tests a resistance level, buyers may see this as an opportunity to accumulate the asset. However, the continued uptrend will depend significantly on the buyers’ (bulls) strength. Therefore, if the bears (sellers) overthrow the bulls, the crypto asset’s price is bound to resume a downtrend.
Another possibility of a bull trap is if the asset exceeds the consolidation it has been oscillating between. An asset may create a range on its price charts of a low and high level it doesn’t cross. These prices create the support and resistance level, respectively.
If the asset’s price breaks above this resistance level, it may entice traders to buy. However, if the asset falls back to its previous range, anyone who bought it can end up making losses.
How to Spot and Avoid a Bull Trap
Now, let’s take a look at several ways you could spot a possible bull trap.
Multiple Tests on Resistance Level
Say we are dealing with the crypto trading pair BTC/USDT. Its immediate resistance level could be at $25k. Using this as your indicator, the bulls might buy to maintain an upward trend, trying to break above $25k. However, as they get closer to this level, they could lack momentum, leading to a bull trap.
Low Buying Volumes
Another pointer is low buying volumes despite a bullish trend. This outlook indicates insufficient interest in the market to maintain an upward trend. As a result, traders can find themselves in a bull trap.
A Huge Bullish Candlestick
Traders should watch out for a larger-than-normal candlestick during a bullish trend. It may lead to whales taking profit, resulting in a bull trap.
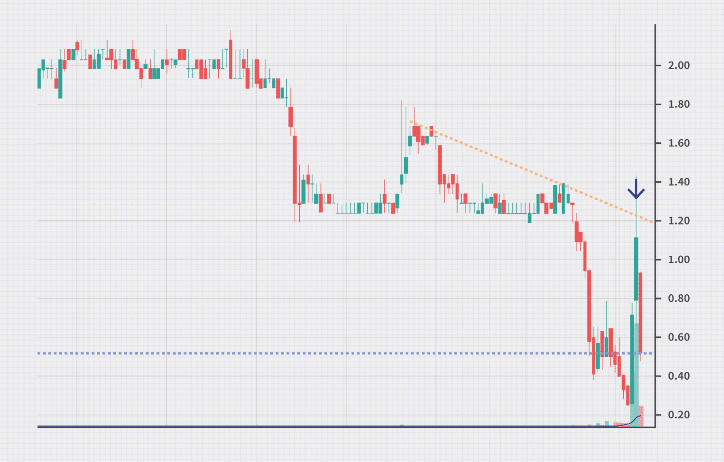
Lack of Rebound Momentum
After a downward trend, the bulls may try to turn the tables, leading to an uptick as they start to buy. However, if the rebound is weak compared to the previous downward trend, it indicates a lack of momentum to sustain a significant bull run. That can lead to traders finding themselves in a bull trap.
Range Below the Resistance Level
If the price trend creates a consolidation pattern before a breakout through the resistance level, it’s generally considered best to wait, as this might indicate a possible bull trap.
Final Thoughts
To avoid falling victim to a bull trap, you can monitor charts and use technical indicators to help you spot one.
Additionally, if you think you are trapped in a probable bull trap, you could set your stop loss below the previous low. This way, you can limit your potential losses.
Lastly, know that crypto trading is a risky activity, and proceeding with caution is advisable. Never put more money at risk than you can afford to lose.