Charting the crypto markets is tricky. For starters, there is no formally agreed-upon price for cryptocurrencies—just a list of average prices on different exchanges. And then there’s the question of how to actually predict this stuff. Some people dismiss the whole process of staring at price charts all day, formally known as technical analysis, as a bunch of hooey, a variation of astrology for crypto bros. Still, there are plenty of sites that let you attempt the feat. This guide goes through the most popular ones and explains some of the key indicators common to each.
A Rundown of Top Crypto Chart Sites
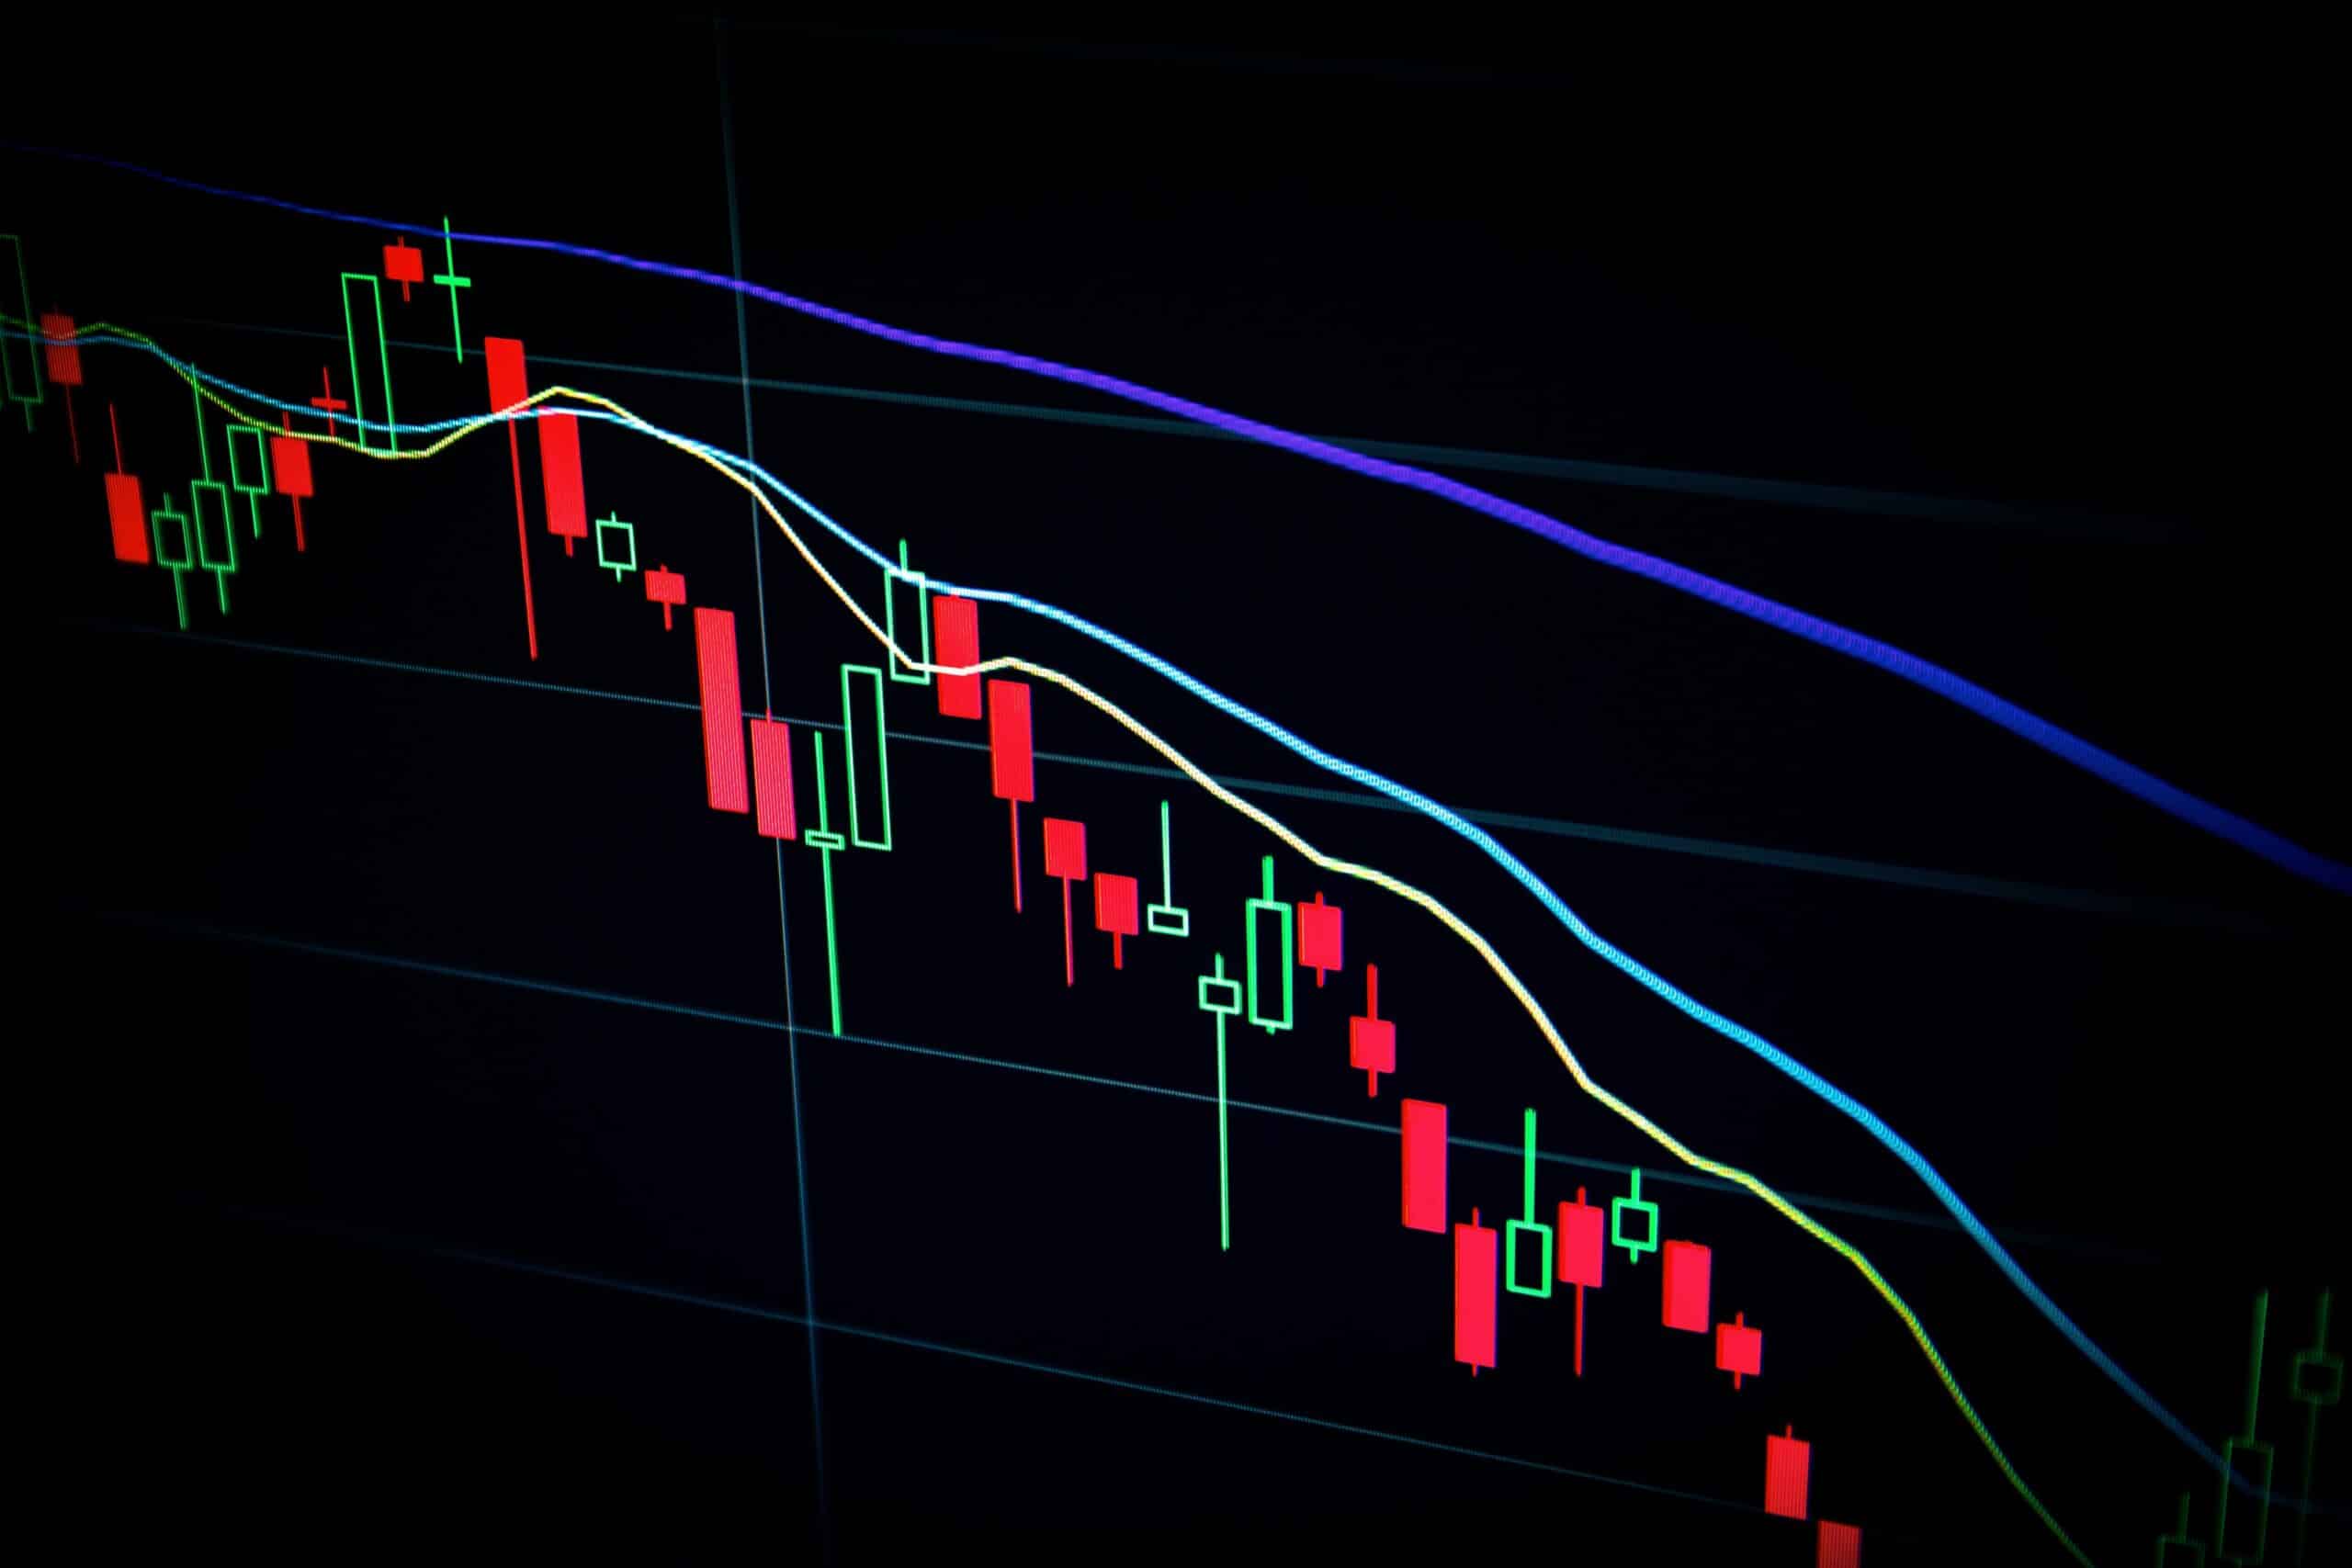
Technical analysis charts like TradingView
Crypto chart sites are a dime a dozen, but there are a few that frequently top the market. Among the most popular sites dedicated to the practice of technical analysis is TradingView. Launched in 2011, it’s a popular interface for charters of both traditional equities and cryptocurrencies. You can track all major coins, such as Ethereum and Bitcoin, as well as indicators that traders use to try and predict the future of the market, such as daily moving averages and Fibonacci curves. It requires a subscription to add multiple indicators to charts.
Price aggregator sites
Price aggregator sites like CoinGecko and CoinMarketCap aren’t quite as advanced as sites like TradingView. They do not, for instance, allow you to add complex technical analysis indicators onto price charts. However, they’re still frequently used as bellwethers of the market as a whole. Their main purpose is to compile the average prices of cryptocurrencies across multiple exchanges to provide traders with an overall snapshot of how the market is performing. This is helpful when you don’t want your analysis to be distorted by a particular exchange.
Cryptocurrency exchanges
Cryptocurrency exchanges themselves are often great tools for technical analysts. The prices of assets on these charts are, of course, limited to that specific exchange, but the charts allow you to add indicators that you might want to use to predict the price of markets on a given company’s order books. The best charts appear on the ‘pro’ parts of exchanges like Binance, Coinbase, and Kraken. And since you’re right there on the exchange, you can execute your trades right alongside the chart.
Key Indicators to Understand
The world of technical analysis is arcane and mysterious. Chart-watchers scan for such obscure patterns as “Bart Simpson haircuts” and “Reverse wedges” as indications that prices are about to rise or fall. Each of these indicators depends on deducing common trends in price charts that, historically, have preceded subsequent price movements.
Most techniques rely on something called a candle wick: a computer-generated vertical line, planted on a graph, that shows whether the price of an asset is falling or rising within a period of time. Candlestick ‘wicks’ are usually green for rising prices and red for falling prices. They represent highs and lows within a given period. For close hawks of price charts, these wicks are produced in real time.
The other key indicator is the ‘moving average’: a line that shows the average price of an asset over a period of time. A 30-day moving average line, for instance, might show the average price of Bitcoin in the past month.
Two other key concepts are “resistance” and “support.” Resistance is a price above or below which an asset is struggling to overcome; support is the price it will reliably fall back on.
Criticisms of Technical Analysis
Technical analysts on YouTube, Twitter, and Telegram are rarely licensed practitioners. Some of them carefully hedge their advice, insisting that they are only offering “risk management” techniques. Others, however, are less salubrious, serving up giddy prognostications with a level of certainty unmatched by the quality of their research.
Some technical analysts, for instance, make predictions on thinly traded coins that they themselves are manipulating. When they say their chosen coin will go up, they buy a tranche, and—like magic—it does.
When dabbling in technical analysis, it is important to be aware of a simple adage: Past performance doesn’t predict future results. A heads on a coin flip does not guarantee a subsequent tails. Many traders who do well off of technical analysis are simply lucky fools who attribute their good fortune to personal genius.
Indeed, some crypto investors believe that technical analysis is fundamentally incompatible with basic economics. Proponents of the efficient-market theory, for instance, believe that an asset’s price reflects the fundamentals of the issuing company (earnings, market conditions, macroeconomic context, etc.). Whatever shows up in the charts merely reflects this information—not the other way around.
Technical analysts, however, may argue that crypto assets have no fundamentals beyond “fear and greed”: two qualities that are, somewhat self-fulfillingly, reflected in the charts.
Still, don’t take it too seriously—lest you fall for the dubious “vomiting camel” formation.